
Huntley’s Housing Market Over the Last 3 Years: Chaos, Comebacks & a Whole Lotta Equity
The Jones Team · Baird & Warner · Huntley, IL
Huntley, Illinois
Real Estate Market Report
Comprehensive monthly market data for Huntley Area 60142 covering January 2023 through April 2026. All figures reflect single-family detached homes.
MLS District 142 — Huntley, IL · Single-Family Detached · Data through April 2026 · Source: MRED / Baird & Warner / Jones Team
April 2026 Median Sale Price
$451,818
Up 19% from January 2023 ($379,950)
Avg. Days on Market — Apr 2026
38 days
Down from 43-day peak in June 2025
Months Supply — Apr 2026
1.6 months
Firmly a seller's market (<3 months)
If you’ve spent the last few years hearing people dramatically announce that the housing market is about to crash every time mortgage rates move a quarter percent… well, Huntley’s numbers would like a word.
Because according to actual single-family home data from 2023 through April 2026, Huntley’s market has done something surprisingly rude to the doom-and-gloom crowd: it stayed strong. Has the market changed? Absolutely. Are buyers more cautious than they were during the “waive every contingency and offer your kidney” era of 2021–2022? Also yes. But the data shows Huntley has remained remarkably resilient through rising interest rates, inflation, affordability pressures, and enough economic uncertainty to make everyone clutch their Stanley cup a little tighter.
+21%
Price Appreciation Since Early 2023
Median price rose from $373,950 (March 2023) to $455,500 (Feb 2026).
~99%
Sellers Receiving Full Asking Price
Every month: homes sold for 98.4%–99.3% of list price.
1.6mo
Months Supply Stays Very Low
A balanced market needs 4–6 months. Huntley has been below 2.3 for 3+ years.
Home Prices Have Been Climbing Like They’re Training for a Marathon
Median Sale Price · 2023–2026
The biggest headline? Home values in Huntley have steadily increased over the last several years. Average median sale prices moved from approximately $376,000 in 2023, to $401,000 in 2024, then $445,000 in 2025, and $454,000 so far in 2026 — nearly an $80,000 jump in just a few years.
And this happened while mortgage rates increased, affordability tightened, and every national headline acted like the housing market was one iced coffee away from complete collapse. Instead? Huntley prices kept pushing upward. Demand stayed strong and inventory stayed relatively tight. Turns out people still like newer homes, larger lots, suburban living, and good commuter access.
Median Sale Price by Month — Single-Family Detached, Huntley IL

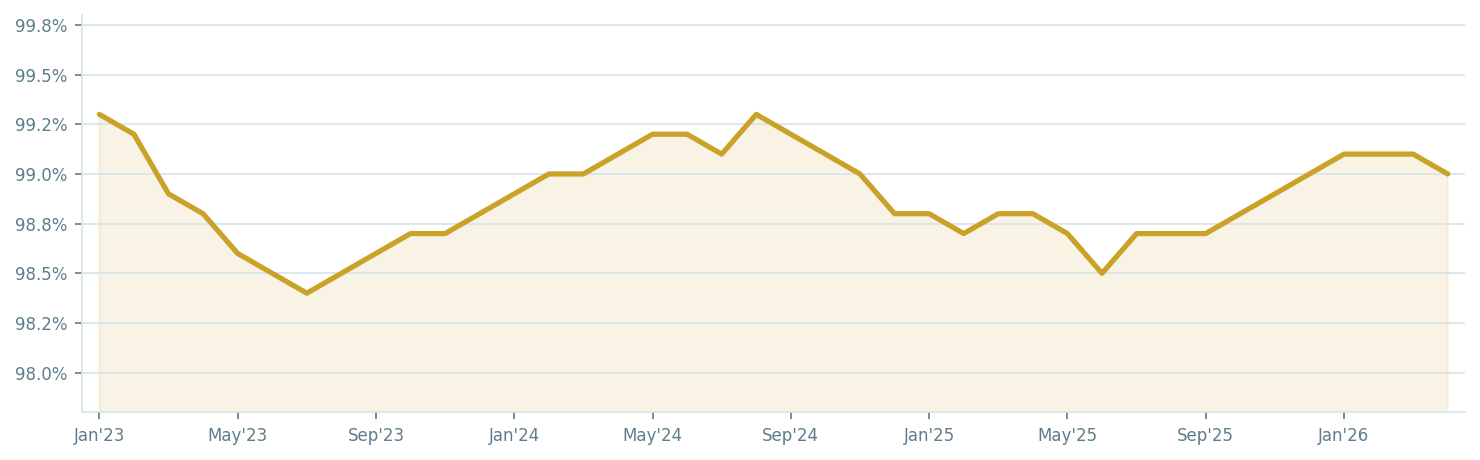
Sellers Are Still Getting (Basically) Their Asking Price
% of List Price Received · 2023–2026
Here’s another stat that tells the real story. Over the last three years, sellers in Huntley consistently received roughly 98.7% to 99.1% of asking price — meaning buyers are still paying close to list price for homes they actually want. That’s very strong.
Today’s buyers are more payment-conscious, more selective, less willing to overlook outdated homes, and significantly less interested in overpaying for a house that still has carpet in the bathroom. Honestly? Fair. But properly priced homes in good condition are still moving. The numbers prove it.
Average % of Asking Price Received — Monthly

Inventory Improved… But Let’s Not Get Carried Away
Months Supply of Homes · 2023–2026
Back in 2023, the market was running at roughly 1.2 to 1.4 months of supply. Buyers were fighting over listings like it was the last rotisserie chicken at Costco. By 2025, inventory increased closer to 2.0–2.3 months, and early 2026 has hovered around 1.6 months of supply.
A truly balanced market is generally around 5–6 months of supply. Huntley is still nowhere near that, which explains why prices have continued holding strong despite higher mortgage rates. There simply still aren’t enough great homes available to fully satisfy buyer demand.
Months Supply of Homes — Monthly (Balanced Market = 5–6 Months)

More Homes Are Hitting the Market
New Listings per Month · 2023–2026
Average monthly new listings went from about 578 in 2023, to 656 in 2024, to 767 in 2025. Many sellers who originally stayed put due to the “lock-in effect” eventually decided life changes still matter more than interest rates.
People still relocate, downsize, upsize, divorce, marry, have babies, retire, and decide they’re emotionally finished sharing one bathroom with three children and a Labrador retriever. Real life keeps happening — and real estate keeps moving because of it.
New Listings per Month — Monthly Count

Homes Are Taking Slightly Longer to Sell (But Calm Down)
Average Days on Market · 2023–2026
Homes averaged around 38 days in 2023, dipped to 36 days in 2024, rose to 41 days in 2025, then settled back to 38 days in early 2026.
Homes are still generally selling in around a month. That’s not a dead market — that’s just a market where buyers occasionally sleep on a decision, look at more than one house, and ask rational questions before signing a 30-year mortgage. The horror.
Average Days on Market — Monthly

Buyers Never Actually Left the Market
Closed Sales per Month · 2023–2026
Monthly closed sales averaged approximately 444 in 2023, 433 in 2024, 516 in 2025, and 502 so far in 2026.
So despite higher rates, inflation, affordability concerns, election-year anxiety, and endless “wait for the crash” YouTube videos — people still bought homes. Because life doesn’t pause while everyone waits for perfect market conditions that may never come.
Closed Sales per Month — Monthly Count
So… What’s the Big Picture for Huntley?
Annual Averages & Highlights
The Huntley housing market didn’t crash. It evolved. The market shifted away from the caffeine-fueled frenzy of 2021 and into something far more sustainable: healthier inventory levels, more balanced negotiations, slightly calmer buyer behavior, continued price growth, and strong overall demand.
Huntley continues to be one of the stronger suburban markets in the area because buyers still value space, newer communities, lifestyle amenities, commuter accessibility, and homes that offer more bang for the buck than closer-in Chicago suburbs.
“The numbers tell the story pretty clearly: Huntley’s market didn’t fall apart. It just stopped acting like it drank pre-workout powder for breakfast.”
Thinking of buying or selling in Huntley?
The Jones Team at Baird & Warner knows this market inside and out. Let’s talk about what these numbers mean for you.
Categories
Recent Posts


It's EASIER to Move When The Jones Team Has Your Back!
+1(224) 622-3237 | jones.team@bairdwarner.com